Project Details
- Languages
- Python
- Service
- Data Visualization
- KPI Analysis
- Softwares
- Tableau
- Jupyter Notebook
Description
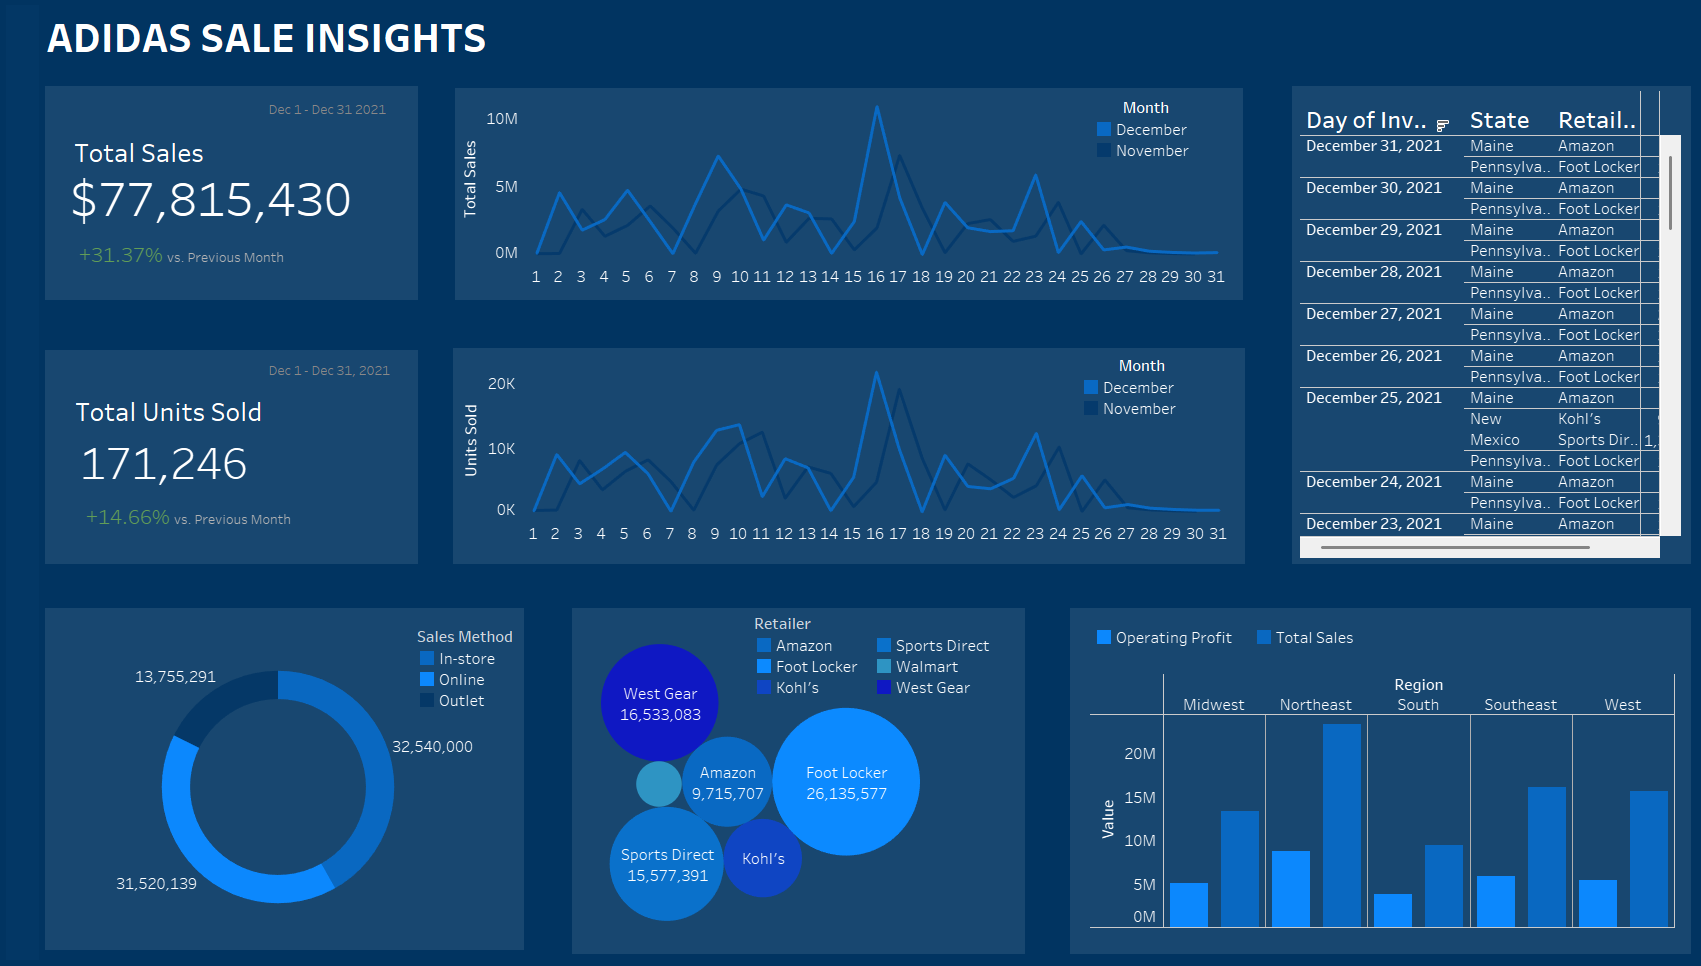
This project uses a KPI dashboard to analyze the sales for the company Adidas for the year of 2021, more specifically the month of December. Overall, this Dashboard dives into the total sales, total units sold, and more in a variety of different methods to give a look into the most profitable aspects of the company. Additionally, the dashboard goes farther by visualizing the differences between the current month given and the previous month and shows the percent increase in total sales, and units sold. In total, this dashboard presents the performance indicators and showcases the functional aspects within sales.