
Project Details
- Languages
- Python
- Matplotlib
- Service
- Analysis
- Time Series Forecasting
- Softwares
- Jupyter Notebook
Description
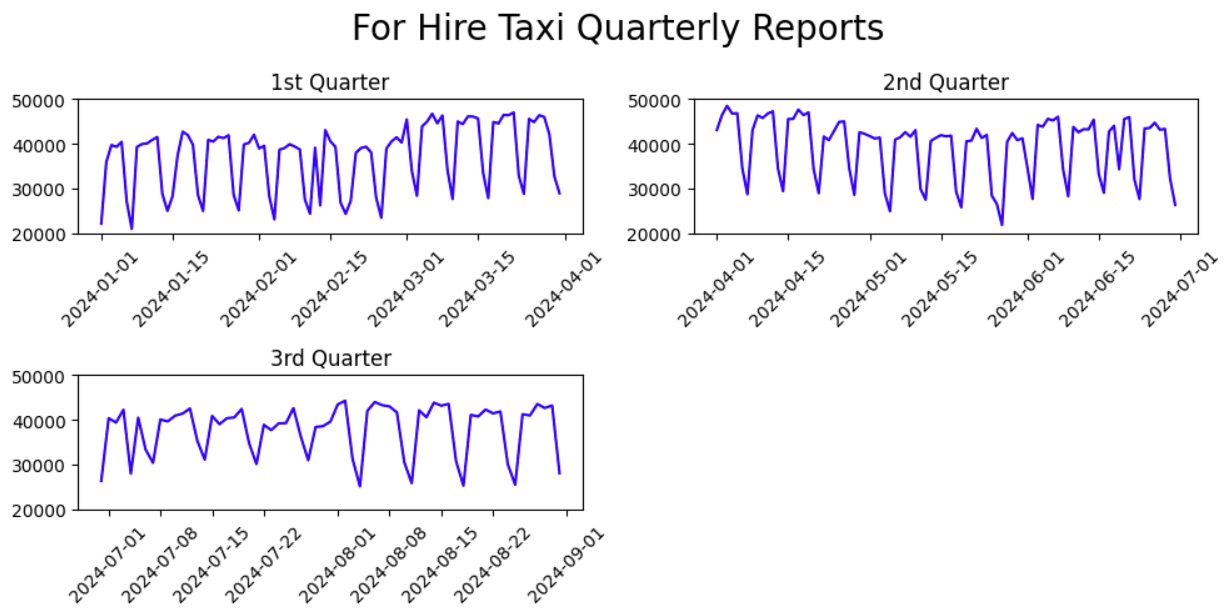
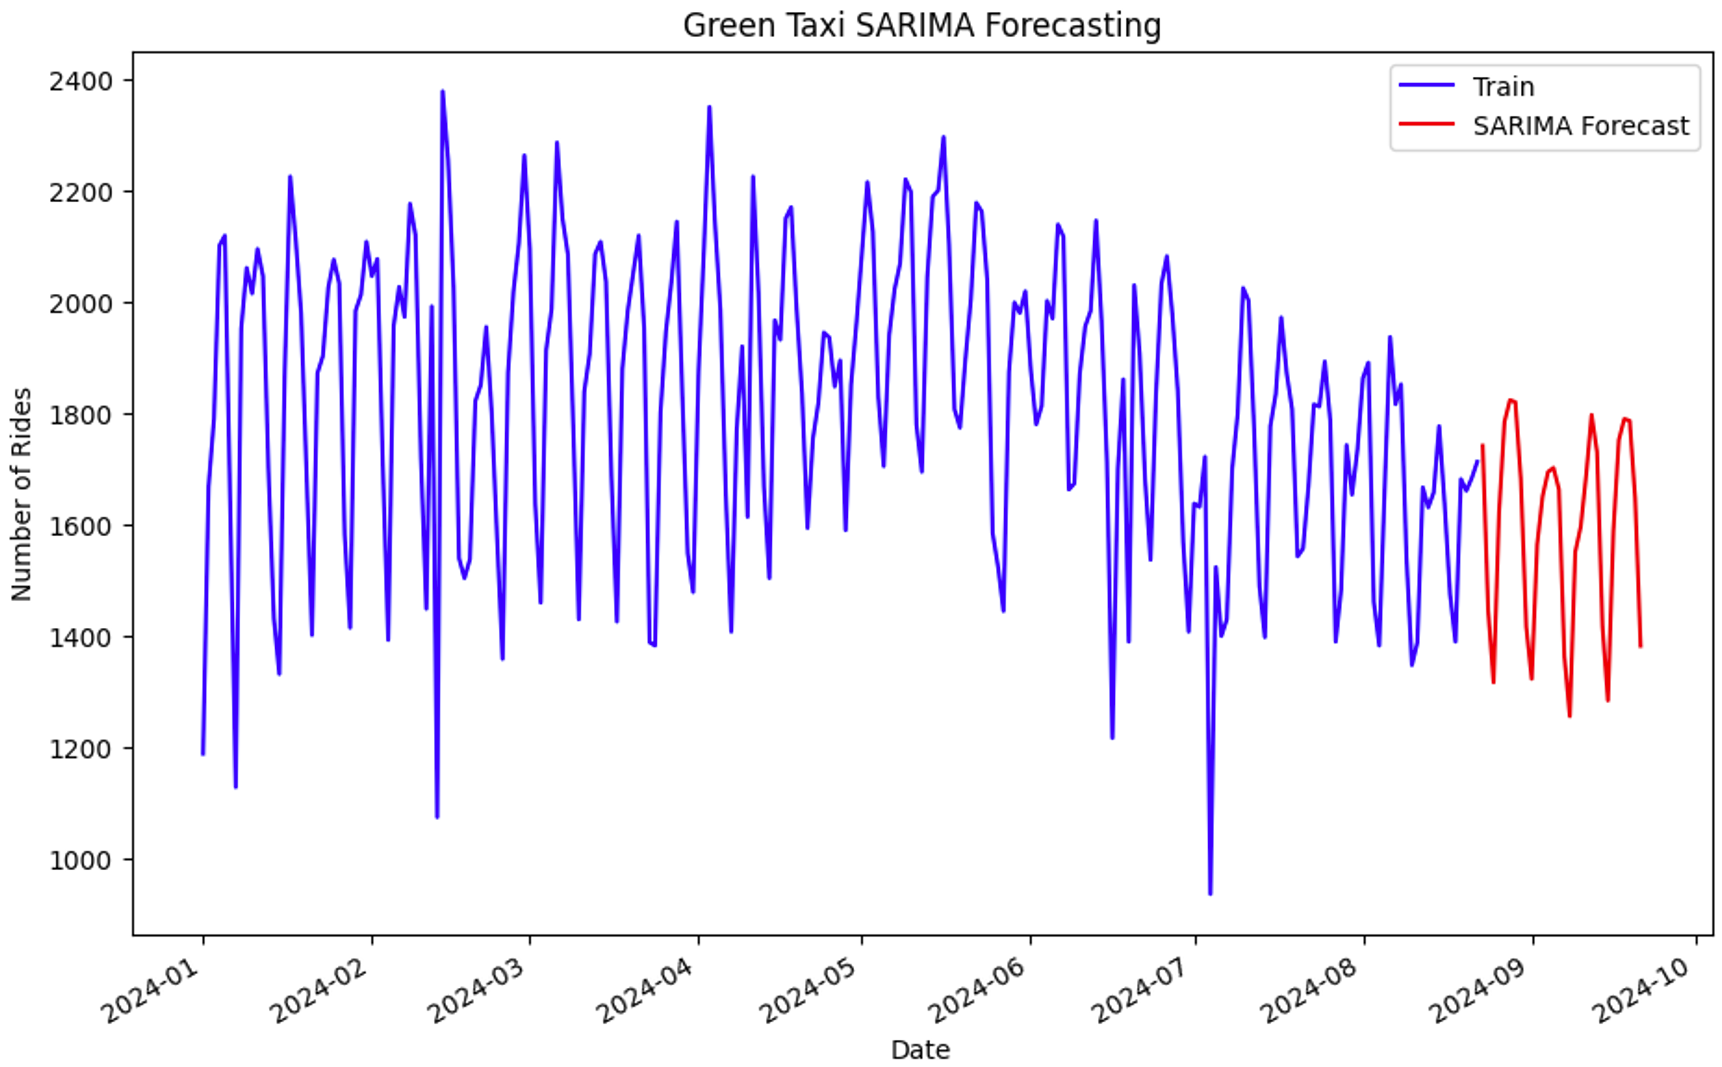
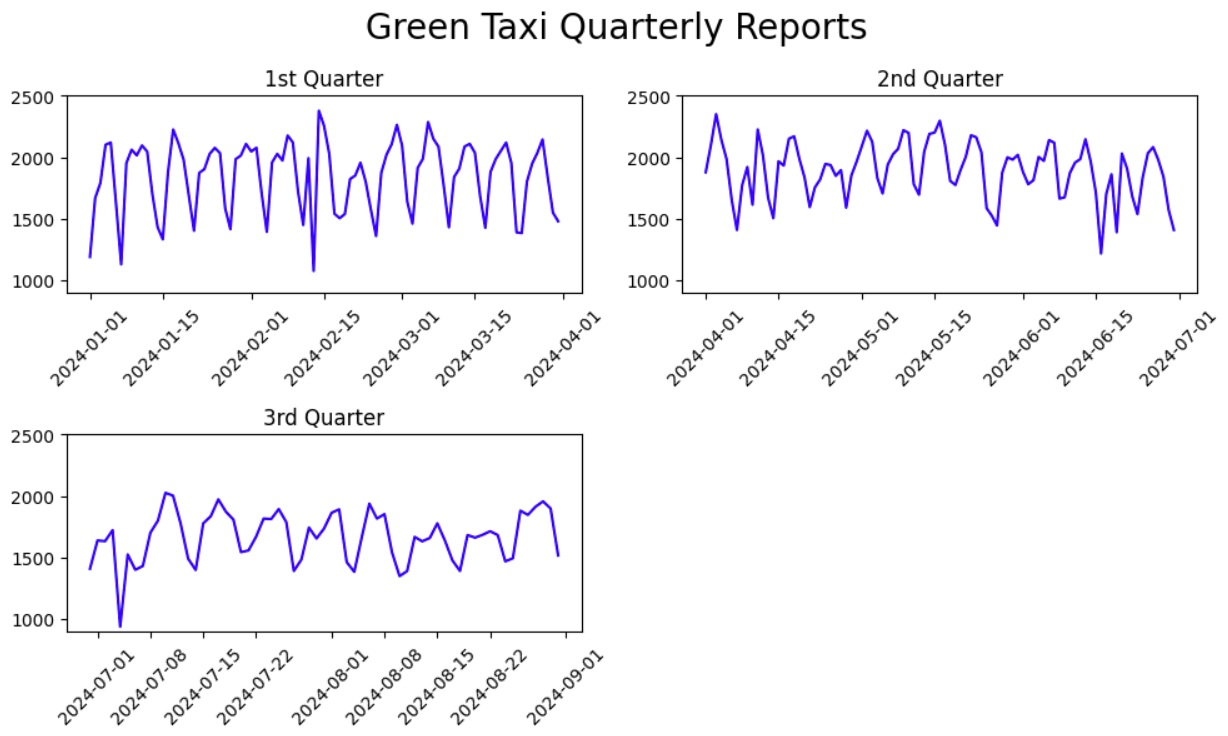
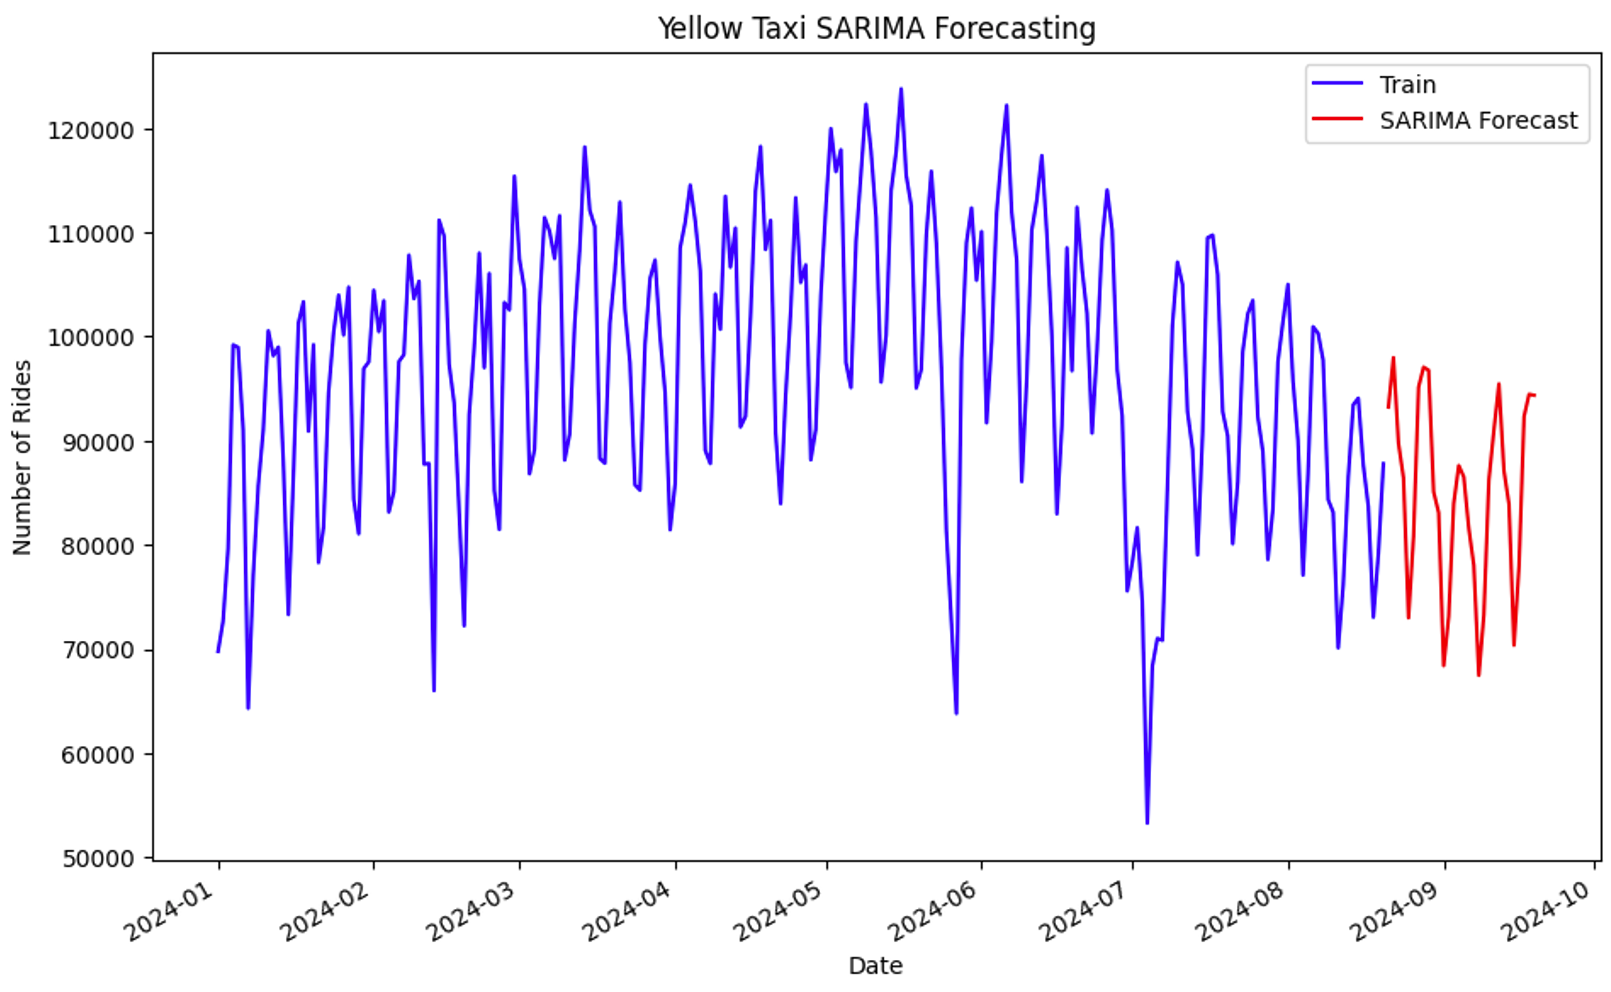
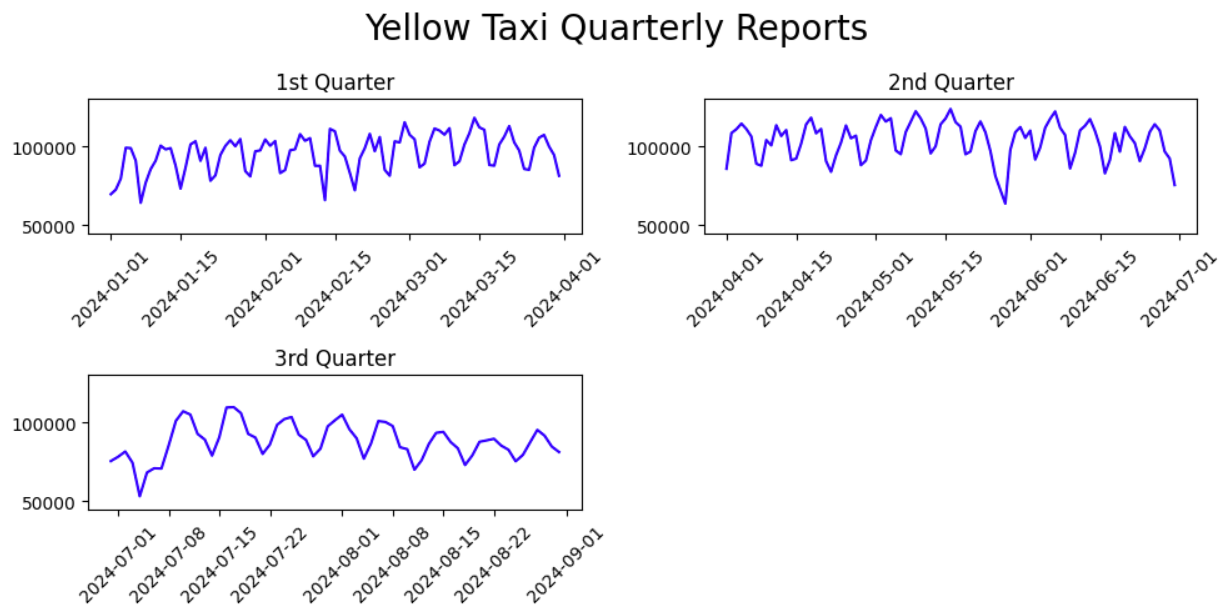
This project delves into an analysis of the amount of taxis requested in New York City. Furthermore, it divides the group of taxis into Green, Yellow, and For Hire taxis, and then shows a forecasting line (red) to predict the amount of taxis to be requested in the future. Additionally, it also delves deeper into the quarterly breakdown of the individual of each of the different categories.