
Project Details
- Languages
- Python
- Service
- Data Visualization
- Exploration Analysis
- Softwares
- Power BI
- Jupyter Notebook
Description
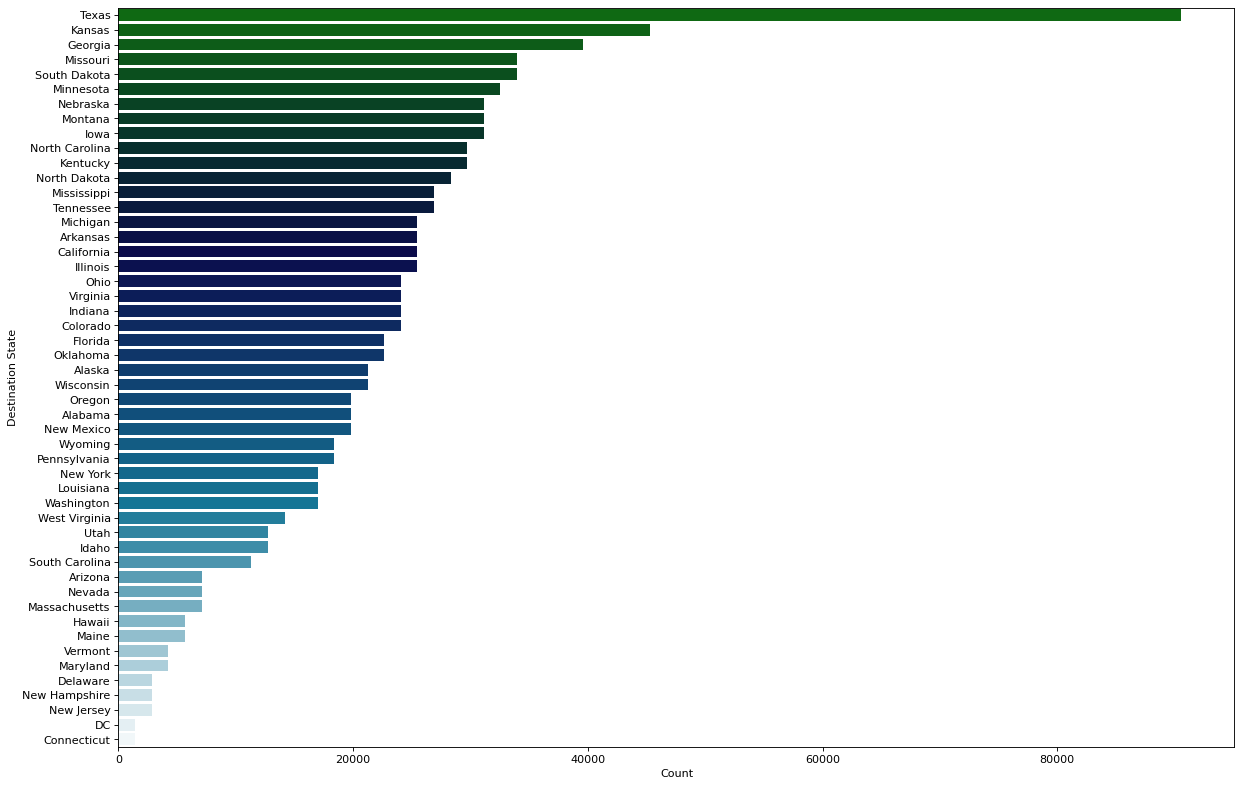
The project presents a data visualization chord diagram illustrating the movement of young adults throughout the U.S.A. It uses Python libraries such as Holoviews and pandas/NumPy for data cleaning and visualization. The chord diagram represents migration patterns of young adults within the US, showing the movement between different states and the count of individuals moving from place to place. The process involved organizing the data, grouping the columns, and creating the chord diagram with nodes using the Holoviews library.